As volatility pushes higher and expected future returns decline, investors are turning to income strategies to generate better long-run returns. Covered calls are one such way to boost returns and reduce volatility.
Covered Call ETFs
There are only two American covered call ETFs:
- CBOE S&P 500 BuyWrite Index ETN (BWV) – The BuyWrite ETN tracks the CBOE S&P 500 BuyWrite Index, which measures the hypothetical returns from a covered call strategy on the S&P 500 index. This ETN, issued by iPath, comes with fees totaling .75% per year.
- S&P 500 BuyWrite Portfolio ETF (PBP) – This fund tracks the same CBOE S&P 500 BuyWrite index, but does so with actual duplication of the strategy. Management fees are .75% per year.
There seems to be no measurable difference between the ETF or ETN as it relates to performance. The BuyWrite ETF loses to the BuyWrite Index due only to the .75% annual fee drag, as you can see from the performance statistics:

Covered Call Strategies
The CBOE publishes its own data on the performance of its indexes. The CBOE’s BuyWrite Index is divided into two strategies:
- BXM – An index for the S&P 500 index that sells covered calls at the money.
- BXY – An index for the S&P 500 index that sells a covered call 2% out of the money.
Performance varies between the two strategies. The example BXY index outperformed the S&P 500’s total return from 1988 to 2012 by 1.2% per year. BXM, a strategy that sold at the money covered calls, beat the total return of the S&P 500 by .16% per year. During the period, the S&P 500 index provided a total annual return of 9.27% per year. Note that almost half of total returns over the 20 year period ended 2010 are actually from dividends (data).
Selling out of the money calls allows for better upside with minimal loss in income compared to the sale of at the money calls. Of course, neither index includes the cost of management fees or transaction expenses in modeling the total portfolio return.
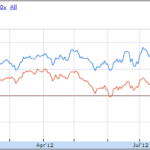
In the past 1-year period, you can see how volatility helps the covered call ETF post larger returns than the S&P500 index.

A DIY Covered Call Portfolio
Investors can create their own covered call portfolio by using less expensive funds like the SPY ETF and then writing their own covered calls each month on their SPY ETF holdings. Supposing that you have significant amounts of investment capital, or access to low-cost option trades, one should manage to beat both the S&P 500 index as well as the covered call ETFs and ETNs based on the index.
The strength of a covered call strategy is made clear when investors look to the total volatility of the strategy relative to simple long-only strategies. Covered calls create income to buffer the index in periods of market declines while taking profits by design when the S&P 500 index rises by more than 2% in one month.
In the 14-year period from 1988 to 2012, the S&P 500 total return index had a standard deviation in returns of 18.96%. The sample portfolio based on selling at the money calls had a standard deviation of 12.69%, and the portfolio based on out of the money calls had standard deviation of 10.47%. The bottom line is that out of the money calls offered very valuable reductions in standard deviation while providing investors with greater total returns.
Disclosure: No positions in any ETFs covered here.


{ 0 comments… add one now }