Are we looking at a market bubble here? Take a look at this chart and consider.
(click to enlarge)
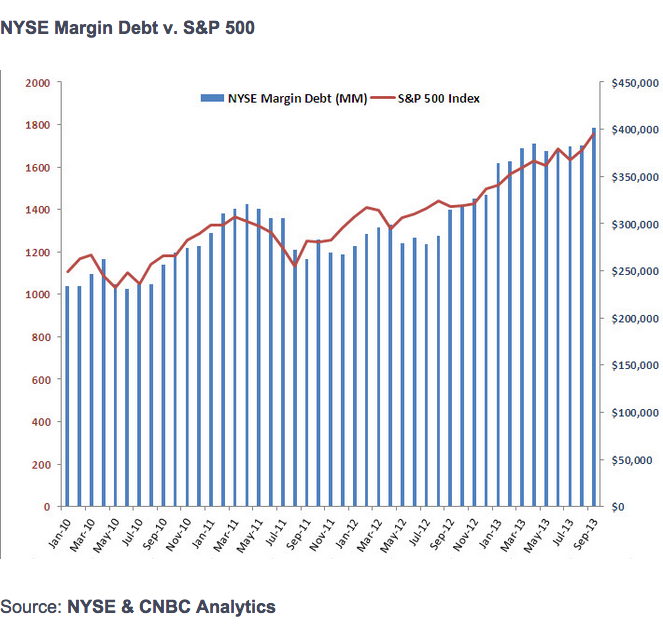
On one hand, I was astounded by the almost perfect correlation between investor margin levels and actual S&P500 Index valuations. It should be a pretty good fit I suppose, assuming people use margin to go long, but I wouldn’t have thought the fit is that tight. Anyway, from an overall market valuation standpoint, it’s easy to see how one could call this market frothy, but at the same time, the same argument could have been made months or years ago and you would have missed some major upside.
Other Market Bubble Signs?
- Twitter IPO – Need I say More?
- Bull Market Without Any Corrections – Up 22% this year and running, the market has yet to undergo any serious corrections in years.
- People are actually talking about the market again. Â This is never a good sign.
The hard reality for traders and investors alike is you need to be in it to win it. Nobody can predict the up days and down days and unfortunately, just a few major up days per year end up comprising a good portion of the total returns in a given year.


{ 0 comments… add one now }