Biotech is back – and Biotech ETFs are breaking records, with one up over 30% YTD. So are many other sectors like Tech, as well as the return of beaten down financials, insurance and real estate, so perhaps that explains the relative lack of coverage of the Biotech resurgence in comparison to some of these other sectors. The difference is that the latter are simply rebounding from near collapse and still stand at a fraction of their prior share price highs. Meanwhile, many biotechs continue to blast past prior all-time highs and show no sign of abating. Drivers include the myriad deals and acquisitions lining the coffers as well as true earnings potential that used to be just a hopeful long shot earlier in the decade. The problem with investing in outfits directly continues to be the risky nature of individual stocks that may have a single candidate with years until approval if approved at all. Hence, the Biotech ETF route is an optimal strategy for most retail investors. As you’ll see below though, not all Biotech funds are created equal (otherwise, there wouldn’t be half a dozen of them – see this Full ETF List of all ETFs in existence for more). They vary greatly in terms of both holdings and weightings which can skew results substantially over given time periods. So, before you leap into any one particular ETF, it’s worth reviewing what makes them tick.
I’ve ranked 5 prominent Biotech ETFs by their return year-to-date and included their top 10 holdings and percentage weightings. A common thread here is the roughly equal weighted ETFs versus the highly concentrated. More on that below:
BBH – HOLDRS Biotech – Up 7%
Amgen Inc. (AMGN) 35.5%
Gilead Sciences, Inc. (GILD) 29.3%
Biogen Idec Inc (BIIB) 14.7%
Genzyme Corporation (GENZ) 7.7%
Life Technologies Corporation (LIFE) 4.4%
SHIRE LTD (SHP) 4.3%
Human Genome Sciences, Inc. (HGSI) 2.2%
Alkermes, Inc. (ALKS) 0.4%
Affymetrix, Inc. (AFFX) 0.2%
Enzon Pharmaceuticals, Inc. (ENZN) 0.2%
BBH is the worst performer of the bunch at 7%, which is roughly matching the return of the S&P500 on the year for context. One can’t help but notice the ETF is almost entirely comprised of a select 3 stocks – Amgen, Gilead and Biogen. I don’t see the utility in this ETF as a diversification tool when 3 issues comprise 80% of the weighting. Investors would be better served in either looking at a different ETF or just buying those individual stocks outright and avoiding the annual expense ratio.
IBB – iShares NASDAQ Biotechnology – Up 13%
AMGEN INC (AMGN) 9.6%
TEVA PHARMACEUTICAL (TEVA) 7.8%
GILEAD SCIENCES (GILD)Â 7.0%
CELGENE CORP (CELG) 6.1%
VERTEX PHARMACEUTICALS (VRTX) 3.8%
BIOGEN IDEC (BIIB) 2.9%
PERRIGO CO PRGO) 2.6%
ALEXION PHARMACEUTICALS (ALXN) 2.5%
MYLAN INC (MYL) 2.4%
DENDREON (DNDN) 2.4%
IBB is weighted heavily toward Amgen, which is already a very mature Biotech, followed by Teva which isn’t a Biotech at all by conventional definition. Teva’s generic drug firm that profits primarily from the patent expiration of existing drugs from companies that actually developed or purchased them first – and virtually all of these products are small molecule, not biologics. While Teva is now getting into the manufacture of follow-on Biologics, they are not an innovator company and probably don’t even belong in a Biotech index, let alone a #2 slot. Following Celgene, the issues are roughly evenly weighted from there. Much success of this fund will depend on the fortunes of these top 3 though.
XBI – SPDR S&P Biotech ETF – Up 14%
Amylin Pharmaceuticals, Inc. (AMLN) 4.6%
Incyte Corporation (INCY) 4.5%
Alkermes, Inc. (ALKS) 4.4%
Regeneron Pharmaceuticals, Inc. (REGN) 4.4%
Acorda Therapeutics, Inc. (ACOR) 4.3%
Dendreon Corporation (DNDN) 4.2%
United Therapeutics Corporation (UTHR) 4.2%
Cephalon, Inc. (CEPH) 4.0%
BioMarin Pharmaceutical Inc. (BMRN) 4.0%
Seattle Genetics, Inc. (SGEN) 4.0%
XBI is more evenly weighted across small and midsized biotechs and noticably absent from the top 10 holdings are larger market cap biotechs like Amgen and Biogen. Unlike some of its brethren, the top 10 here are actually all innovator Biotechs as opposed to raw materials suppliers and a generic representing top holdings elsewhere.
PBE – PowerShares Dynamic Biotechnoly – Up 18%
Millipore Corporation Common St (MIL) 6.1%
Biogen Idec Inc (BIIB) 5.1%
Alexion Pharmaceuticals, Inc. (ALXN) 4.8%
Gilead Sciences, Inc. (GILD) 4.4%
Life Technologies Corporation (LIFE) 4.4%
Waters Corporation Common Stock (WAT) 4.4%
Amgen Inc. (AMGN) 4.4%
ViroPharma Incorporated (VPHM) 3.9%
Sigma-Aldrich Corporation (SIAL) 3.9%
InterMune, Inc. (ITMN) 3.7%
While PBE is a stronger performer in the pack, take note of the prominent position in Millipore which services the biotech industry and has run up substantially on the year on buyout news sending shares higher by over 50% just since February. Note that other top issues Waters and Sigma-Aldrich are also suppliers to the industry, not innovator biotech franchises.
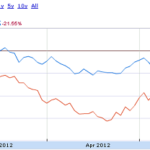
FBT – First Trust NYSE Arca Biotechnology – Up 32%
Intermune Inc. (ITMN) 12.4%
OSI Pharmaceuticals, Inc. (OSIP)6.8%
Sequenom Inc. (SQNM) 5.8%
Millipore Corporation (MIL)5.7%
Amylin Pharmaceuticals, Inc. (AMLN) 5.7%
Nektar Therapeutics (NKTR) 5.1%
Affymetrix, Inc. (AFFY) 4.7%
Alexion Pharmaceuticals, Inc. (ALXN) 4.5%
Amgen Inc. (AMGN) 4.2%
Celgene Corporation (CELG) 4.2%
FBT is up huge YTD because of its holdings in Intermune (ITMN) and OSI Pharma (OSIP) while its competing ETFs have very little or no exposure to these huge movers. Intermune is up a whopping 255% on the year and OSI Pharma is up 93%, both on major deal news.
Which is the Best Biotech ETF for You?
The verdict depends somewhat on how much you value the top holdings and their relative weighting. Personally, I would be partial to XBI since it provides an optimal mix of both pure biotech plays and evenly spread weighting. This is a similar phenomena to what we see in the broad market Equal Weight ETF which has been beating the market indices like Dow and S&P500 which are weighted by share price and market capitalization specifically. In an equal-weighted portfolio, obviously, individual performance is less meaningful and the smaller companies (which often outperform) get equal representation, thus juicing returns.
Disclosure: No position in any ETF reviewed in this article.


{ 0 comments… add one now }
{ 1 trackback }