Over the years, there has been much debate in the investment community over an equal-weighted index vs. weighting by market cap or share price. There are pros and cons to each method of weighting. For instance, while the S&P500 is comprised of 500 stocks representing a broad swath of sectors in the US, the top 10 holdings represent 19% of the total index weighting (2% of stocks represent 19% weighting for an almost 10X “over-representation”). Case in point: ExxonMobil comprises over 3% of the weighting alone due to its market capitalization. Therefore, if ExxonMobil experiences an undue calamity (Valdez II?), the S&P500 index may be unfairly maligned by a single holding that isn’t representative of the over 3% of the US Stock Market as a whole. The Dow Jones Industrial Average actually weights its components by share price, which is even more archaic.
That’s where equal weighting comes in. The Rydex S&P Equal Weight ETF (RSP) spreads the weighting much more evenly with the Top 10 holdings comprising 2.3% of the overall weighting. In fact, each quarter, the fund resets all its holdings at 0.2% and lets them float for the remainder. This provides for a smoothed, diversified return profile that isn’t overly reliant upon any particular stock or sector per se.
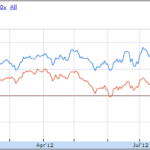
RSP Performance vs. SPY
1 mo 9%Â vs 7%
3 mo 8%Â vs 4%
6 mo 13% vs 9%
1 yr 81% vs 48%
2 yr 0%Â vs -10%
In matching up the Rydex S&P Equal Weight ETF against the most common proxy for the S&P500 (SPY), it’s evident that over multiple periods of time ending March 2010, RSP outperforms. Much of this probably has to do with the extreme beating small caps took during the financial crisis and incredible 100%+ returns several sectors saw from the bottom in March, not to mention, the Financials that comprised a large weighting in the S&P500 index that may not come back for a long time. However, investors who were in RSP at any time in the recent past are now looking at impressive returns with respect to SPY.
Be mindful that given the larger weighting of the country’s largest, most established companies in SPY, the dividend yield is higher at 2.0% for SPY vs. 1.4% for RSP. The RSP expense ratio is a reasonable 0.4% which is higher than some low-fee S&P mutual funds and ETFs, but not high by any means. What the future holds is uncertain if for instance, large caps outperform small caps and mid caps. Of course, in that case, SPY would be expected to outperform. But if you’re looking for a true company-weighted index and want to avoid overweighting in any particular stock or sector, it’s probably worth checking out RSP.
Disclosure: No position in RSP. Trading Portfolio hedged with naked call options on SPY 120 March expiry.


{ 0 comments… add one now }